
China Top 10 Eco Energy Solutions for Global Buyers
China’s clean-energy sector has moved from large-scale manufacturing to practical solutions for homes, factories, farms, and transport networks. This guide introduces China’s top 10 eco energy solutions for global buyers, including solar panels, wind systems, battery storage, heat pumps, and smart energy controls.
Each solution is examined through performance, durability, certification, installation needs, and long-term operating costs. A rooftop solar system may look efficient in a product brochure, yet roof direction, local sunlight, dust, and grid rules can change its real output. Battery projects require similar care. Cell chemistry, temperature control, warranty terms, and replacement planning matter greatly.
Details matter most.
China offers strong manufacturing capacity and competitive pricing, but buyers should not rely on factory claims alone. Independent testing, traceable components, clear technical documentation, and verified after-sales support can reduce costly surprises. International certifications may support confidence, but they do not replace local engineering checks or site assessments.
This overview focuses on eco energy solutions that can support measurable emissions reductions and reliable energy access. It also recognises practical limitations. Some technologies remain expensive without incentives, while others depend on suitable infrastructure or skilled maintenance. Market data can change quickly, and supplier quality is not always consistent. Buyers should compare lifecycle value rather than purchase price alone. The goal is not to present one perfect answer, but to help decision-makers ask better questions before selecting a responsible Chinese energy partner.
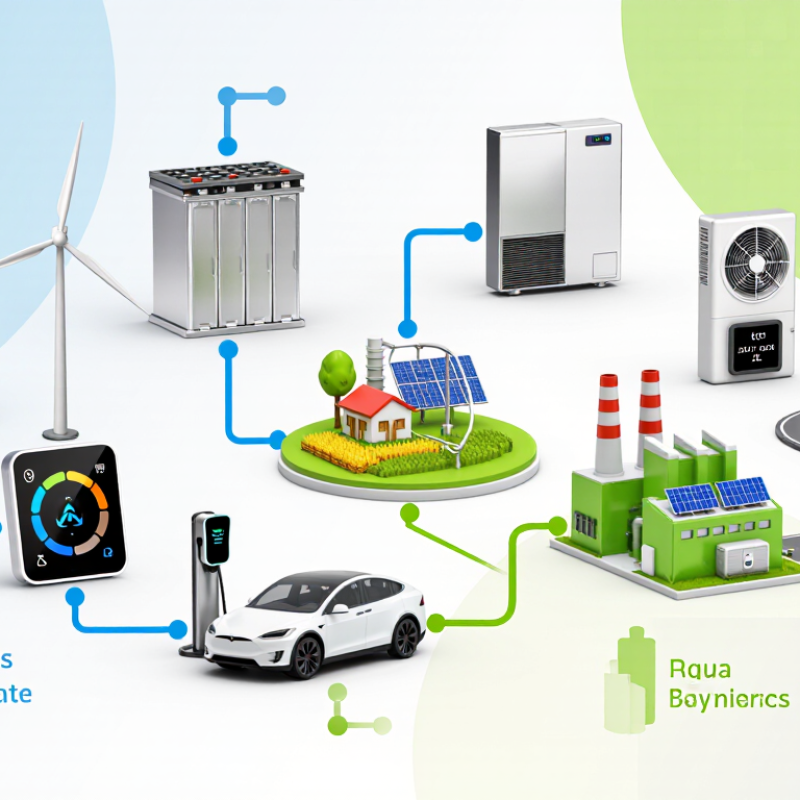
Solar PV and Wind: China Produced Over 80% of Global PV Modules in 2023
China’s clean-energy supply chain has become central to global procurement. The International Energy Agency reported that China produced more than 80% of global solar PV modules in 2023. It also held dominant positions in wafers and polysilicon production. This scale supports competitive pricing, fast capacity expansion, and wider access for international buyers.
The numbers are substantial. IRENA recorded about 216.9 GW of new solar capacity in China during 2023. China also added roughly 75.9 GW of wind power that year. In practical sourcing work, this means buyers can compare module efficiency, degradation rates, delivery schedules, and certification records across a deep manufacturing market. Product details matter.
Not every low-cost offer is equally dependable. A large production share does not guarantee stable quality, traceability, or suitable after-sales support. Buyers should review third-party test reports, factory quality controls, warranty terms, and compliance with local grid requirements. The IEA’s Renewables 2024 analysis also highlights manufacturing concentration as a potential supply-chain risk. That concern deserves attention.
Wind equipment adds another layer. Turbine suitability depends on wind speed, terrain, transport access, and maintenance capability. A specification that works on a coastal site may fail economically inland. Real projects expose these differences. Data can guide decisions, but site evidence must challenge assumptions. Industry forecasts are useful, yet they are not contracts.
China Top 10 Eco Energy Solutions for Global Buyers - Solar PV and Wind: China Produced Over 80% of Global PV Modules in 2023
A data-based overview of scalable Chinese clean-energy solutions, market indicators, buyer applications, and key procurement considerations.
| Rank | Eco-Energy Solution | China Market Indicator | Global Buyer Applications | Main Environmental Value | Key Procurement Dimensions |
|---|---|---|---|---|---|
| 1 | Solar PV Modules | China accounted for more than 80% of global PV module manufacturing capacity in 2023, according to the International Energy Agency. | Utility-scale solar Commercial rooftops Residential systems | Generates electricity without direct operational carbon emissions and reduces dependence on fossil fuels. | Power output, module efficiency, degradation rate, temperature coefficient, certification, warranty, traceability, and recycling policy. |
| 2 | Distributed and Rooftop PV Systems | China had approximately 254 GW of distributed solar PV capacity by the end of 2023, representing a major portion of its total solar fleet. | Factories Warehouses Schools Retail buildings | Uses existing roof space, lowers transmission losses, and supports on-site clean electricity consumption. | Roof loading, fire safety, inverter compatibility, structural survey, net-metering rules, installation access, and after-sales service. |
| 3 | Solar PV and Battery Energy Storage Systems | China's cumulative new-type energy-storage capacity reached approximately 31.4 GW by the end of 2023, according to national energy-sector data. | Peak shaving Backup power Microgrids Off-grid power | Improves renewable-energy utilization and reduces the need for fossil-fuel backup generation. | Usable energy, round-trip efficiency, cycle life, thermal management, battery chemistry, safety testing, warranty, and fire protection. |
| 4 | Onshore Wind Power Equipment | China's total wind-power capacity reached approximately 441 GW at the end of 2023, making it the world's largest national wind-power market. | Wind farms Agricultural areas Remote grids Industrial power | Produces renewable electricity with a relatively low land footprint and no direct fuel consumption. | Rated power, rotor diameter, hub height, wind-class suitability, transport logistics, availability, noise limits, and maintenance support. |
| 5 | Offshore Wind Power Systems | China had approximately 37.7 GW of offshore wind capacity by the end of 2023, the largest offshore wind fleet in the world. | Coastal electricity Island grids Port electrification Industrial zones | Provides high-capacity renewable electricity near densely populated coastal demand centers. | Water depth, foundation type, corrosion protection, subsea cables, typhoon resistance, installation vessels, service access, and environmental impact. |
| 6 | Wind Turbine Blades and Critical Components | China's large-scale wind manufacturing ecosystem supplies blades, generators, towers, gearboxes, converters, and control systems for domestic and export projects. | Replacement parts Turbine upgrades New projects Repowering | Improves wind-turbine output and extends the operating life of renewable-energy assets. | Material strength, fatigue resistance, dimensional tolerance, aerodynamic performance, transport packaging, inspection records, and compatibility. |
| 7 | Utility-Scale Solar and Wind Hybrid Plants | China's renewable-energy development increasingly combines solar, wind, transmission, and storage assets in large energy bases, especially in northern and western regions. | Grid-scale generation Green power supply Energy-intensive industry | Balances different generation profiles and increases the effective utilization of grid and transmission infrastructure. | Resource assessment, power-forecasting accuracy, grid-code compliance, storage sizing, land use, curtailment risk, and project finance model. |
| 8 | Green Hydrogen Electrolysis Systems | China is a major global manufacturing and deployment center for electrolyzers, supported by large-scale renewable-energy projects and industrial hydrogen demand. | Ammonia production Refineries Steelmaking Heavy transport | Can replace hydrogen produced from unabated fossil fuels when powered by verified renewable electricity. | Hydrogen output, electricity consumption per kilogram, operating pressure, dynamic response, purity, stack life, water quality, and safety certification. |
| 9 | Renewable-Energy Charging Infrastructure | China had approximately 8.6 million charging facilities by the end of 2023, including both public and private charging equipment. | Electric vehicles Electric buses Fleet depots Solar carports | Supports transport electrification and can connect vehicle charging with solar generation and energy storage. | Charging power, connector standards, operating temperature, protection rating, payment platform, load management, remote monitoring, and maintenance. |
| 10 | Biomass Power and Organic-Waste Energy Systems | China's biomass-power capacity reached approximately 44 GW by the end of 2023, covering agricultural residues, municipal waste, and other organic feedstocks. | Waste treatment District heating Industrial steam Rural energy | Converts organic waste into electricity or heat while reducing landfill use and uncontrolled methane emissions. | Feedstock availability, moisture content, fuel flexibility, emissions control, ash handling, heat recovery, plant efficiency, and local permits. |
Related Posts
-
10 Best Eco Energy Solutions for a Sustainable Future
-
How to Choose the Best Energy Solutions for Your Home and Business
-
What is an Energy Audit for Home and Why is it Important?
-
2026 Best Eco Energy Solutions for a Sustainable Future?
-
Top 10 Eco Energy Solutions in China for a Sustainable Future?
-
How to Find the Best Eco Energy Solutions for Your Home?